by Kyla Winchester
I saw a post on LinkedIn the other day: it was a photo of a range of weights on a weight machine, with varying amounts of wear where the weights connect to the machine itself. The wear pattern followed a typical statistical distribution: there was more wear on middle-weights, compared to lighter or heavier. This pattern would also be seen if, for example, you put the heights of 500 people into a chart: there would be a peak in the middle with most heights clustered around that point towards the middle, and then tapering off towards left and right. This comes as no surprise (since I put it in the title), but the caption said, “If you look, data is everywhere.”

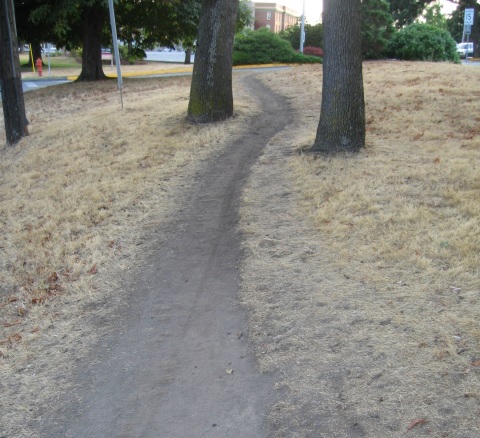
I started thinking of other examples from life: the first one that came to mind was snow and traffic. I remember reading something about how the snow left after a storm (when cars and people have made tracks but before a plow goes through) can tell you how a street is actually used. There is also a term, “desire paths,” which describes footpaths created by the feet of many people simply walking this space over and over again, even though it is not a sidewalk, driveway, or official path. Again, this is data: people are creating a path where there isn’t one, and we can see the result of it even if we don’t see them walking. Both of these examples could be used by relevant parties: if you’re redesigning a street, you could see how much room cars actually need, and where they turn, and park; and where pedestrians cross even without crosswalks; the end result being that you could design a street already knowing how it’s actually being used.
How is this relevant for fundraising and nonprofits? There is no lack of data, but it may not be helpful data, or may only tell part of the story. Consider: when you launch a DRTV ad, you get donations, but you also get complaints. How many complaints, about what, from whom? Is it a consistent percentage of views, are there more this time than last, does it stay consistent or taper off, do those who complain also donate, etc. Or if you send a DM piece, you get a certain number returned in the mail: have people moved or passed away? Is it the same small percentage of returns, or does it fluctuate, or does it depend on whether you mailed your database or a list, or does it depend on which list? If you do an outreach event, what do you bring with you, and what gets packed up to go back to the office? (Pamphlets, magazines or newsletters, stickers, other resources?) What do people pick up, what do they read, what do they take home? Do more people sign up for the newsletter than the petition, and what pitches are used for each?
You know your organization best, and you know your donors, and you know your data. You’ve probably already determined the best KPIs for your campaigns, and know which images are more likely to appeal, etc. However, if you’re ‘stuck’, for example on developing a new campaign, or on how to engage program participants, or looking for more nuanced info, “hidden” data sources may be a treasure trove.
