
Plan for the Unplannable, Part 2
By Tracy Mazur
Welcome back! Our last article explained what an FMEA table is and how it may help you get in front of potential issues for a variety of areas in your organization. In this article we will explore how to make a simple FMEA. This one is just the basics, you can make them more complicated, but doing even just this will help you pinpoint problem areas and begin to work towards proactive fixes.
Making an FMEA table
The chart itself has eleven headers at a minimum: Function, Potential Failure, Potential Effect of Failure, (S)everity, Potential cause of failure, (O)ccurence, Current Process Controls, (D)etection and, finally, RPN – Risk Priority Number.

You can add additional columns such as one for reference items, where you can number items.
For the sake of brevity in this article, I will be using a theoretical FMEA for a simple website for a small non-profit that accepts donations online and holds events.
Rating Scale
The different columns in my example have letters in parenthesis. Those letters are in parenthesis to indicate they are part of an equation in the last column—which means we’ll be putting numbers in those columns.
Before you start going through the FMEA, decide on the ranking scales you will use. It doesn’t matter what you use as long as you use it consistently for all three categories. If you decide to use 1-10, then use 1-10 for each column. When picking your scale, you cannot go from 0 to any number, you must start at 1. The last column multiplies the scores so including 0 will wipe out the whole score if it is ever used. The ranking for an FMEA table always is from best to worst; so a 10 would be very bad and a 1 would be not so bad at all, for all the ranked columns.
The next step, after picking out the increments for the scale, is to come up with a guide for each category. You’re taking something that is slightly subjective and adding some objectivity to it. You don’t need to over-think it, but assign a few examples to various points in the scoring. For a very basic example, on a 5 point scale for severity, it could look like:
- Minor: little noticeable impact, ignored by donor/end user
- Minor: minor impact, noticed by donor/end user but no dissatisfaction generated
- Medium: impacts donor/ed user, generates dissatisfaction, may impact donation
- Serious: impacts donor/end user, serious dissatisfaction with feedback submitted, will impact donation possibilities
- Severe: major impact to donor/end user, reputation damaging dissatisfaction, serious impact to donation possibilities
Overall, this is the area of the FMEA where you will have the most customization to fit your organization and make sense for the functions you are evaluating for the FMEA table. This may be the point where you decide to do separate, themed tables for various departments or areas of your organization instead of putting everything into one, since these rankings may not make sense when you move from a technical user-facing item, such as an online donation form, to an in-person event or when looking at internal administration functions.
For the examples below I will use a 1-5 scale. This is purely for the sake of an example, because you can use any scale that fits the needs of your organization best. If you want more detail, use a larger scale; if less precision makes sense for the FMEA you are creating, then use one with fewer numbers.
Function
In this column we start with not the failure we anticipate, but by asking, what are the basic functions of your subject for the chart. In the case of our example, we would list out all of the functions of the website. A full FMEA can be as detailed as you want and may include functions that aren’t something a user activates manually, such as information security or single sign-on functionality.
| Function | Potential Failure |
| Make a donation | |
| Look up events | |
| Contact the organization | |
| Read the org's blog articles |
Potential Failure
This is where we get to brainstorm and come up with all the ways the function listed in the first column can go wrong. For our example I generated a few simple issues, but this is where your SMEs will shine. They probably have already run into some past failures that could recur, or they know of areas with the potential to go wrong.
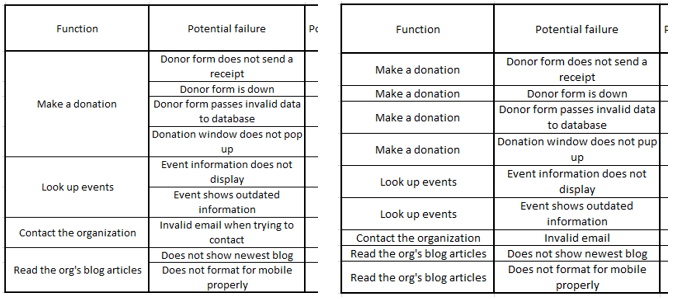
You may have multiple potential failures for each function, and that is perfectly normal. Some functions can only go wrong one possible way, others have a multitude of ways to go off the rails. If you have several potential failures for the same function, you can either relist the function multiple times or merge the function cell into one for the block. If you plan on being able to filter your FMEA chart later as a spreadsheet then you will want to relist each function. If you need to show the final FMEA chart to a committee of stakeholders, then the merged version might be better. Comparing our two small examples side by side below highlights the readability of the merged version when sharing with various audiences.
Potential effect of failure
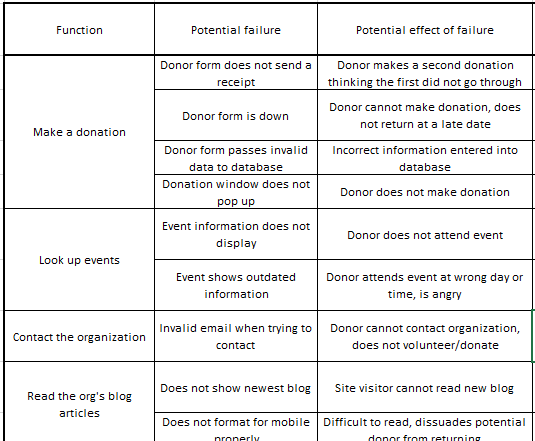
For every failure listed you will now add a potential effect of the failure. This should be the most likely potential effect. Yes, we can “what if” everything into something ludicrous, but listen to the experience of your SMEs and add in what is the most likely outcome if the failure occurs.
(S)everity
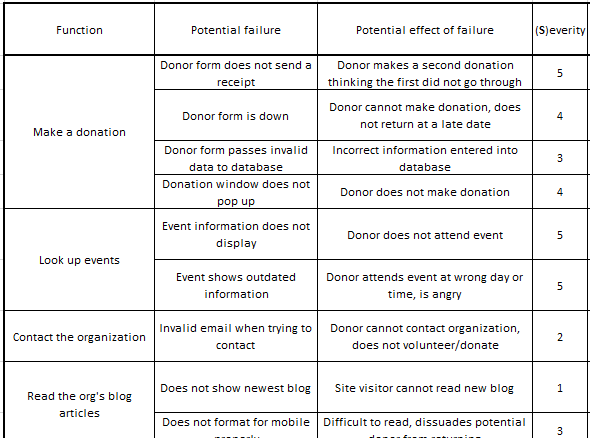
This is our first step towards the calculation that will help us determine what potential failures are the most critical. Taking the customized ranking system you created above, you and your SMEs will evaluate each failure to see how bad it is and then assign a score.
Potential Cause of Failure
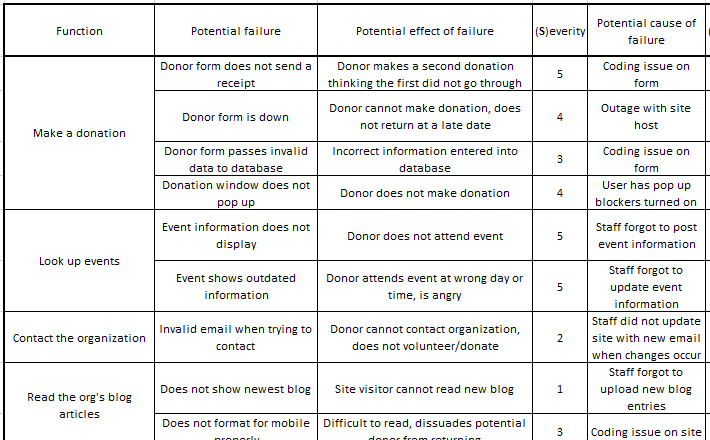
After ranking how bad the failure is you will put down known cause for the failure. You want to find what the root cause is of each failure. If you aren’t sure what is driving it, then some root cause analysis may be called for as part of the FMEA process. Some common tools for digging into the real cause of issues include izakaya diagrams (AKA “fishbone diagrams”), the 5 Why’s and walking the process flow. But that’s another article entirely.
(O)ccurence
Here we rank the how often this failure happens due to the root cause identified in the previous column. Once again, you’ll be using a ranking system generated prior to filling out the chart, where a low number means the failure occurs less often. I think of occurrence as being more objective than some of the other ranked columns. This means you can come up with a firmer rating scale for it easily. Some easy examples can include:
| 1 | Almost never |
| 2 | Monthly |
| 3 | Weekly |
| 4 | Daily |
| 5 | Nearly every time |
| 1 | 10% of the time |
| 2 | 20% of the time |
| 3 | 30% of the time |
| 4 | 40% of the time |
| 5 | 50% of the time |
Current Process Controls
This is where you notate what current processes you have in place to prevent the corresponding failure. And yes, it is entirely likely you may have spots where you have no process in place to control the failure. That is okay; be honest and put the information in. Part of the whole process of doing an FMEA is to uncover those kinds of situations.
(D)etection
Detection is our last column for ranking. This is where we rank how easy it is to detect the problem listed on this line. The lower the number, the easier it is to find, which also means it’s easier to fix. If your staff regularly finds the problems themselves you may put a lower number in, since you probably find the issues on your own. If it’s something that only comes to light when someone external to your organization contacts you, it would be a higher number since you have to wait until the error has already done damage to uncover it. And if it’s something that can only be found by going to look for it without knowing it’s happening, it would have a much higher number.
Risk Priority Number (RPN) = S x O x D
This column is one of the best reasons to use a spreadsheet to make an FMEA, because few people enjoy doing any arithmetic, no matter how simple. To generate the RPN, multiple Severity by Occurrence and by Detection. The higher the RPN then the higher the priority should be in finding new ways to either fix the existing issue or prevent further recurrence.
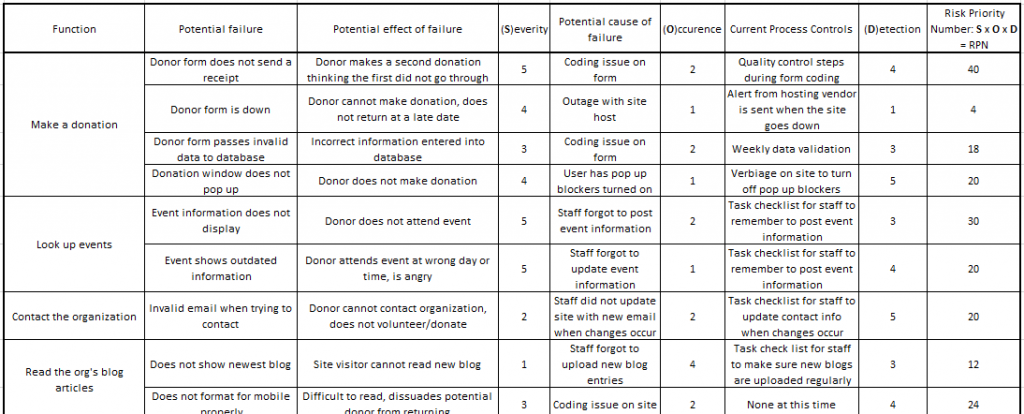
As you can see in our highly theoretical examples below, our biggest concern is going to be when the donor form does not send a receipt for some reason. Right after that is the issue with event information not displaying. We have two items that scored highly but two very different reasons. One is possibly a technical issue that may require some troubleshooting to identify the exact issue and produce a correction, while the other very likely can be fixed with a few changes to process.
Though the items that have high scores may be concerning, don’t ignore the lower-scoring items. There is a chance that those could be very easily prevented with a few quick fixes. If you are trying to change your organization from being reactive in the face of disaster to proactive, then having a few quick wins to show instant results can help you gain traction and buy-in with both your peers and superiors.
What’s next?
You certainly aren’t done once the FMEA table is completed. Your next step is to actually work on the issues uncovered and then, at a later date, revisit this and see if the scoring has changed as well as adding to it any new issues that may have popped up. An FMEA table is very easily turned into an action register by adding a few columns after the RPN. But the most important part to remember is an effective FMEA table is one that gets revisited and acted upon.